Criteria for assessing performance
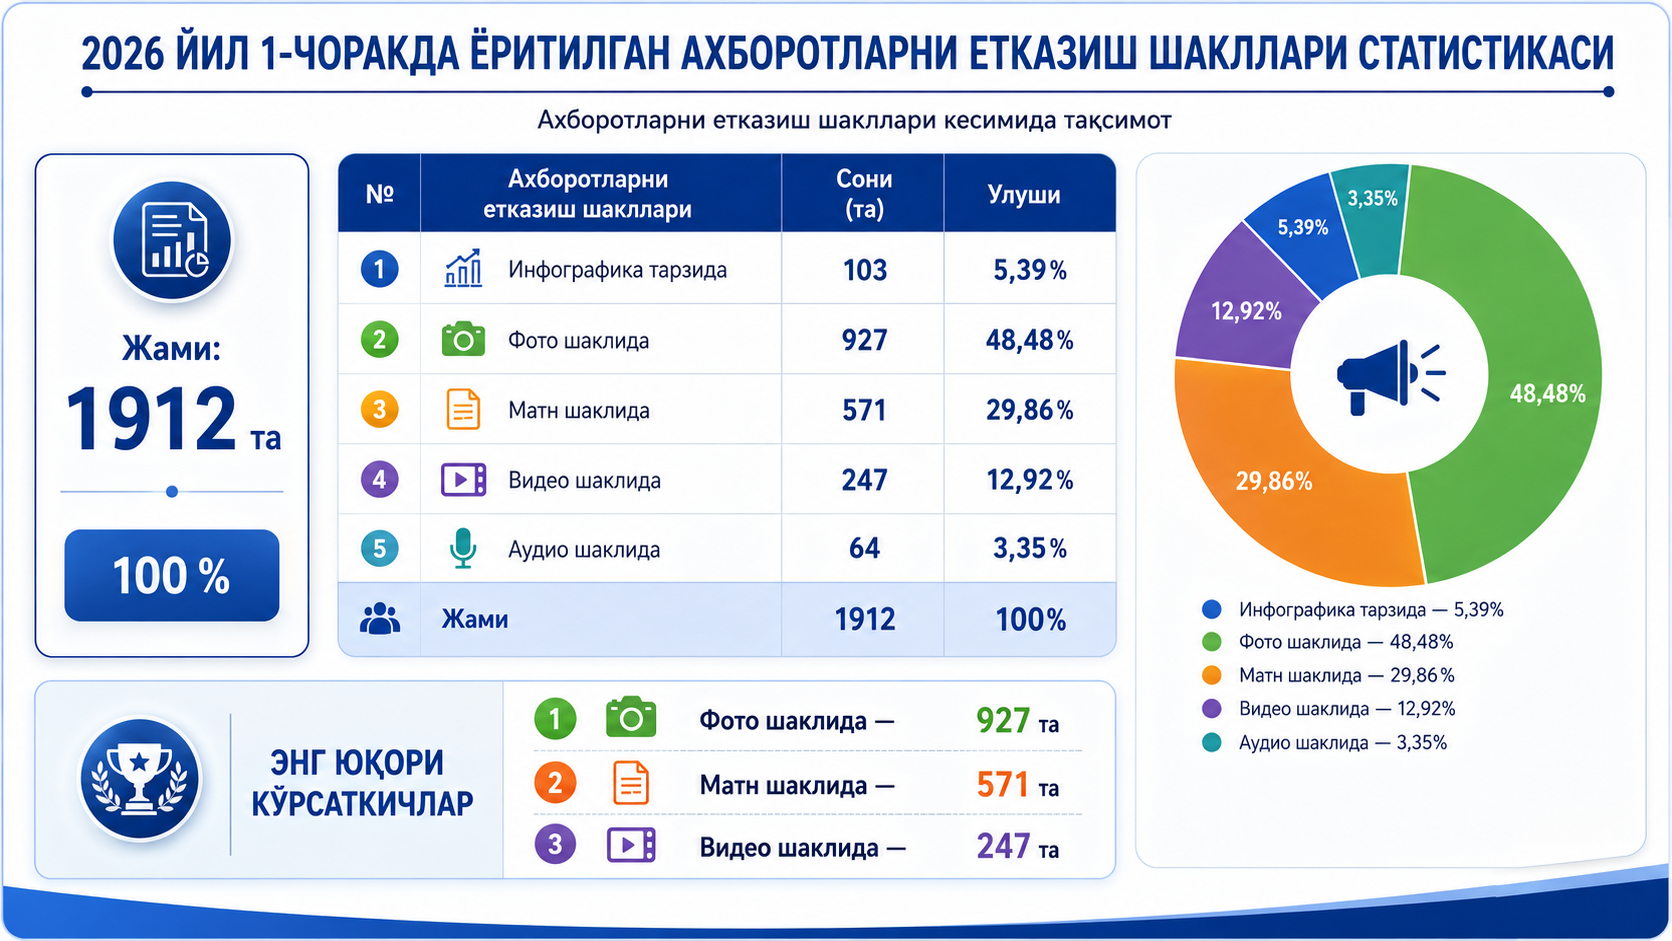
1.4 Form of information delivery
Statistics on the form of delivery of information covered
by the Council in the first half of 2026
|
No. |
Form of information delivery |
Number |
Share |
|
1. |
In the form of infographics |
103 |
5,39% |
|
2. |
In the form of photos |
927 |
48,48% |
|
3. |
In the form of text |
571 |
29,86% |
|
4. |
In the form of video |
247 |
12,92% |
|
5. |
In the form of audio |
64 |
3,35% |
|
Total: |
1912 |
100% |
|